Showing posts with label ca$h money. Show all posts

Tuesday, April 14, 2009

Nothing is Certain but Death and Logarithms

Dear Dr. Math,
I've heard that if I wanted to, ahem, "creatively adjust" some numbers, I should use numbers that start with the digit 1 more often. Why is that?
Inquiring Re. Statistics

Dear IRS,

How timely of you to bring this up! Indeed, there is a general pattern in the digits typically found in measured quantities, especially those spanning many orders of magnitude, for example: populations of cities, distances between stars, or, say, ADJUSTED GROSS INCOME. The pattern is that the digit 1 occurs more often as the leading digit of the number, approximately 30% of the time, followed by the digit 2 about 18% of the time, and so on. The probability, in fact, of having a leading digit equal to d is equal to log(1+1/d), for any d =1,2,...,9. This rule is called Benford's Law, named (as is often the case) for the second person to discover it, when he noticed that the pages of the library's book of logarithms were much dirtier, hence more used, at the front of the book where the numbers began with 1. In pictures, the distribution of digits looks like this:


It seems counterintuitive that any digit should be more likely than any other. After all, if we pick a number "at random," shouldn't it have the same probability of being between 100 and 199 as it does of being between 200 and 299, etc.? If so, the probability of getting a 1 as the first digit would in fact be the same as getting a 2. However, this turns out to be impossible, and it has to do with a very common misconception about "randomness."

The fact of the matter is that there's actually no way to pick a number uniformly at random without further restrictions. So, for example, if I tell you to "pick a random number," it must be the case that you're more likely to select some particular number than some other (which ones, however, are up to you.) Assume this weren't true, so all numbers are equally likely. Just to be clear, let's focus on the positive integers, the numbers 1,2,3,... Now let p be the probability of picking any one of them, say the number 1. Since they're all supposedly equally likely, this means p is also the probability of picking 2, and of picking 3, and so on. So the chance of picking any number between 1 and 10, say, is 10*p. Since probabilities are always less than 1, this means p < 1/10. OK, well, by the same reasoning, the probability of picking a number between 1 and 1000 is 1000*p, so p < 1/1000. Similarly, p < 1/1,000,000, p < 1/(1 googol), and so on. In fact, it follows that p < 1/N for any N, and the only (non-negative) number that has that property is p = 0. Ergo, the chance of getting any particular integer is 0, from which it follows (for reasons I won't get into here) that the probability of picking an integer at all is 0, a "contradiction." That's math-speak for "whoops." You can only pick an integer uniformly from a finite set of possibilities.

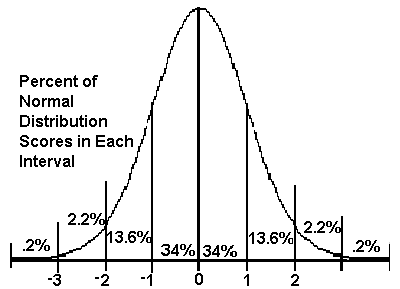
So, what do we mean when we say that a number is "random"? Well, there are ways for things to be random without being uniformly random. For example, if you roll a pair of dice, you might say the outcome is "random," but you know that the sum is more likely to be 7 than it is to be 2. Similarly, if you pick a person (uniformly) randomly from the population of the U.S. (note: the population is finite, so that's OK), you might model his/her IQ as a random quantity with a normal distribution, a.k.a. a "bell curve," centered around 100. The existence of different distributions besides the uniform distribution is the source of a lot of popular misunderstandings about statistics.

None of that explains where Benford's Law comes from, of course, but it's at least an argument why it's plausible that the distribution isn't uniform. To explain the appearance of the particular logarithmic distribution of digits I wrote above, we'd need some kind of model for the quantities we were observing, and it can't just be "the uniform distribution on the positive integers," because we already showed that there's no such thing.

One reasonable idea is that the thing we're measuring might be "scale invariant." That is, if it has a wide range of possible values, it might not matter what size units we use to measure it--we'll get roughly the same distribution of numbers. So if we imagine switching from measuring lengths in feet to measuring them in "half-feet,"* say, then anything that gave us a foot-length starting with 1, say 1.2 feet or 1.8 feet, will now give us a half-foot length starting either with 2 or 3, in this case 2.4 and 3.6 "half-feet." If the two distributions are the same, then the occurrence of a first-digit 1 must be the same as the occurrence of a first-digit 2 or 3, combined. By the same reasoning, any quantity initially beginning with a 5, 6, 7, 8, or 9 would now begin with a 1, when doubled. Similarly, by tripling the scale, measuring in "third-feet" and assuming the same invariance, we'd get a 1 as often as a 3, 4, or 5 put together. And so on. By considering every possible scale, this line of reasoning leads you pretty much straight to Benford's Law. This scale invariance kind of makes sense if we're measuring ADJUSTED GROSS INCOME, since incomes vary by so much (so very, very much), whereas something like height wouldn't exhibit scale invariance, being more tightly distributed around its mean.

Another perspective is that when we measure things, we're frequently observing something in the midst of an exponential growth. Exponential growth happens all the time in nature, for example, in the sizes of populations or SECRET OFFSHORE BANK ACCOUNTS with a fixed (compound) interest rate. The key feature of a quantity growing exponentially is that it has a fixed "doubling time." That is, the amount of time it takes to grow by a factor of 2 is independent of how big it is currently. For example, let's assume your illegal bank account (well not yours, but one's) doubles in value every year and starts off with a balance of $1000. At the end of year 1, you'd have $2000, at the end of year 2 you'd have $4000, at the end of year 3 you'd have $8000, and so on. So for the whole first year, your bank balance would start with the digit 1, but during the second year you would have some balances starting with 2 and some with 3. During the third year, you would have balances starting with 4, 5, 6, and 7. If we AUDITED your account at some randomly chosen time, we'd be just as likely to see a balance starting with 1 as a balance starting with 2 or 3, combined, and so on. In other words, we have the same "scale invariance" conditions as before, which lead us back to Benford's Law. The same would be true no matter how quickly the account grew; exponential growth sampled at a random time gives us a logarithmic distribution of digits.

To give you a concrete example, I went through the first 100 powers of 2--1, 2, 4, 8, 16, ...**--and instructed my computer to keep track of just the first digits. The results, as you can see, conform pretty nicely to Benford's Law:


For whatever reason, it appears that Benford's Law, like TAX LAW, is the law.

-DrM


*Sounds vaguely Tolkienesque, don't you think?

**32, 64, 128, 256, 512, 1024, 2048, 4096, 8192, 16384, 32768, 65536, 131072, 262144, 524288, 1048576, 2097152, 4194304, 8388608, 16777216, 33554432, 67108864, 134217728, 268435456, 536870912, 1073741824, 2147483648, 4294967296, 8589934592, 17179869184, 34359738368, 68719476736, 137438953472, 274877906944, 549755813888, 1099511627776, 2199023255552, 4398046511104, 8796093022208, 17592186044416, 35184372088832, 70368744177664, 140737488355328, 281474976710656, 562949953421312, 1125899906842624, 2251799813685248, 4503599627370496, 9007199254740992, 18014398509481984, 36028797018963968, 72057594037927936, 144115188075855872, 288230376151711744, 576460752303423488, 1152921504606846976, 2305843009213693952, 4611686018427387904, 9223372036854775808, 18446744073709551616, 36893488147419103232, 73786976294838206464, 147573952589676412928, 295147905179352825856, 590295810358705651712, 1180591620717411303424, 2361183241434822606848, 4722366482869645213696, 9444732965739290427392, 18889465931478580854784, 37778931862957161709568, 75557863725914323419136, 151115727451828646838272, 302231454903657293676544, 604462909807314587353088, 1208925819614629174706176, 2417851639229258349412352, 4835703278458516698824704, 9671406556917033397649408, 19342813113834066795298816, 38685626227668133590597632, 77371252455336267181195264, 154742504910672534362390528, 309485009821345068724781056, 618970019642690137449562112, 1237940039285380274899124224, 2475880078570760549798248448, 4951760157141521099596496896, 9903520314283042199192993792, 19807040628566084398385987584, 39614081257132168796771975168, 79228162514264337593543950336, 158456325028528675187087900672, 316912650057057350374175801344, 633825300114114700748351602688

Friday, February 20, 2009

Let's Make a Deal or No Deal

Dear Dr. Math,
On the show Deal or No Deal, if the contestant gets to the point of only having two cases left they have the option to switch cases. Should they switch or not? Is this the same as the Monty Hall problem?
Daniel G.


As Scott Bakula would say, Oh boy. I guess there was no way I was going to get away with writing a math advice blog and not having to explain the Monty Hall Problem at some point. For those of you out there who may be unfamiliar with the MHP, here's the way it goes:

You are presented with three doors and told that behind one door is a car and behind the other two are goats. (Here we're assuming you want the car and not the goats, but in these tough economic times maybe they should be reversed.) You pick a door and then the host, the venerable Monty Hall, always opens one of the other two doors to reveal a goat. He then offers you the chance to switch to the remaining third door. It turns out that it's always in your best interests to switch, given the available information. Doing so improves your chance of winning from to .

Now, I see some of you reaching for that email button, getting ready to fire off an angry letter about how it just can't be true that switching is better than not switching. After all, there are two remaining doors and you don't know which has the car, so aren't your odds 50-50? It's impossible! Believe me, I sympathize, but hold it right there. Plenty of people, even professional mathematicians, have said the same thing as you. Whole books and websites have been devoted to this topic, people have written simulators that you can try out for yourself, the advice columnist Marilyn vos Savant essentially made her career by being right about this problem and explaining why. The MHP is math's version of an optical illusion--you can stare at it and stare at it, but until you actually get the ruler out and measure, you won't be convinced. The sad truth is: Ellen Tigh's a cylon, Darth Vader built C3PO, and switching doors in the Monty Hall Problem improves your chance of winning from to .

Instead of opening up all the old wounds the MHP has inflicted over the years, let me try to offer my own perspective on how I think about the problem (inflicting all-new wounds!), and then maybe we can take those same ideas and apply them to the Deal or No Deal question to show why it's different.

Let's back the train up all the way to the station and talk a little about what probability is--what it means. Warning: Heavy Philosophy-Type Stuff Ahead. As I've mentioned previously, my opinion is that probability is a way to quantify the uncertainty we have about the state of the world. Therefore, it's highly dependent on what information we feel that we possess about the things we observe and what consequences the information may have. For example, everyone's favorite "random" activity is flipping a coin--assuming it's a "fair coin", the probability is that it will come up heads and that it will come up tails. But what does that really mean? Physically, we can model all the variables that go into the action of flipping a coin--weight distribution of the coin, air resistance, amount and location of force applied to the coin, the direction the coin is tossed, elasticity of the landing surface, etc. If somehow we could measure all of these things between the time the coin was tossed and the time it landed, and if we had access to a powerful enough computing device, we could predict whether the coin would come up heads. At the very least, we could guess ("calling it in the air") and improve our chances to more than . Going back a step, the only parts of this system unknown to us ahead of time are the variables due to the tossing itself--the human element of thumb against coin. If, for example, we knew that the person tossing the coin were an amazingly skilled athlete who could control his hand and arm motions with extreme precision and who had practiced the technique of tossing a coin enough that he could reliably make it come up heads, we again could improve upon our 50-50 guess. As a third possibility, consider the case where the coin has already been flipped but we haven't seen the outcome yet (the referee's still holding it); if somebody could sneak a peek at part of the coin and tell us what they saw, we could update our information and make a better guess.

So, what is the "real" probability? In my view, and this might be hard to swallow at first, the answer is there isn't one--the question itself is flawed. "Wait a minute," I can hear you objecting, "Can't we just perform experiments and measure the frequency of heads? Flip a coin a hundred times and about 50 of those will be heads, etc.?" The problem there is that you're observing a different event each time. You can never step in the river twice, nor flip the same coin. All the repetition does is validate the predictive power of your mental model that says that the factors that go into flipping coins are beyond your comprehension and result in the heads side and the tails side being equally likely. As an alternative, say, you could have the mental model (shared by many people) that those hundred coin flips were predestined to occur the way they did and that through meditation/prayer/drugs/etc. you can actually see into the future and predict the outcome of the next flip. It happens that the first model tends to be more successful than the second (or any others) in this instance, but we should be careful to separate the things we're assuming from the things we observe. As E.T. Jaynes wrote in Probability Theory: The Logic of Science, trying to verify the probability of an event by performing experiments "would be like trying to verify a boy's love for his dog by performing experiments on the dog."

See, part of the problem with the way we humans interpret the world is that the physical laws we rely on--for example, that two colliding objects obey the law of conservation of momentum--can quickly outpace our abilities to calculate their consequences--say, the motions of every molecule of a balloon-full of air. We use probability as a way of approximating the behavior of these complex systems instead of having to understand them completely, but that doesn't mean that the events "are" random. A more powerful being might see things differently, the way adults see tic-tac-toe differently from the way little kids do. But we seem to be stuck with this uncertainty about complex systems. And there's really no system on Earth more complex than a human, which brings us back to the MHP.

In the setup to the Monty Hall Problem, we've assumed some things, all of which pertain to the actions of other people. First, there is the assumption that the car is equally likely to be behind any of the three doors (actually, assumption zero is that there even is a car at all). Presumably, some producer or somebody chose which door to put it behind--it's possible they might have had a preference for door #1, for example, because it's closer to the loading dock or looks better on TV. If we had records of thousands of shows, we might gain some insight into their decision process and detect some bias. But we're assuming otherwise. Secondly, and this is the real key, we have the assumption that Monty Hall knows which door has the car behind it. As a consequence, we can deduce that by opening up the remaining door (or one of the two remaining doors, if we initially chose the one with the car), he has added information to the set of things we know about the game. Namely, we know that if the car had been behind one of the other two doors, he would have been forced to open the door he did--that's essentially why switching gives us a chance of winning. If the other door had opened by chance, say a gust of wind blew it open and we happened to see the goat, then we'd have no reason to conclude anything about whether we should switch, because we just as easily could have seen the car. So, by knowing what Monty knows, we can improve our chances. In coin terms, it's as though we had a prearranged deal with the referee where if the coin is tails, he just tells us half the time and stays quiet the other half, and if the coin is heads he always stays quiet--so if he doesn't speak, we know there's a chance the coin is heads.

Now, on Deal or No Deal, hosted by the incomparable Howie Mandel, the situation is somewhat different. For those who haven't seen the show, it works like this: a contestant picks one of 26 briefcases, each containing a different dollar amount. He/she then opens some or all of the remaining briefcases and decides whether to keep going or sell the initial case. In the extreme situation in which he/she keeps going all the way to the end and there are only two cases left, the contestant has the option to keep the original case or switch. Let's you and I pretend that we were on the show. For simplicity, let's assume that initially 25 of the 26 cases had $0, and the one remaining case had $1 million. Also, let's assume that we opened 24 cases and inside each one was a big fat $0 (we got to say "NO DEAL!" a bunch of times, which was fun; also, they brought out Ellen Degeneres at some point). What does that mean about our prospects? Should we switch? Well, our assumptions, again, were (1) all cases were equally likely to contain the million dollars, and (2) nobody on the show knew which case was which. Under those assumptions, it doesn't matter if we switch or not, since the probability is of each case having the million. It's just like the Monty Hall Problem if Monty didn't know which door had the car behind it--nobody has given us any additional information with which to prefer one case over the other. If, however, we knew that Howie knew which case had the winner, and he had started the show by opening all the other cases, then we should absolutely switch in a heartbeat, because it would improve our chance of winning from to . It's all about what information Howie gives us. Also, if he could give us Anya's phone number while he's at it, that would help us out, too.
-DrM

Monday, February 9, 2009

In the Big Apple, I prefer Honeycrisp.

I've been called out by Short Round over at alt85 again, concerning a recent article in The New York Times:

The article included one piece of information with direct relevance to the little people: "a new study from the Center for an Urban Future, a nonprofit research group in Manhattan, estmates that it takes $123,322 to enjoy the same middle-class life as someone earning $50,000 in Houston." [Tugs nervously at collar.] And since the average median* per-capita income in Houston in 1999 (according to houstontx.gov) was $20,101, and since the Urban Future people's figures would suggest that $20,101 in Houston is worth less than $49,578 in New York (for reasons that the newly returned Dr. Math could surely explain better than I,** unless he disagrees, in which case I challenge him to a duel)... Well, New York is f**kin' expensive. Not news.
Short Round


Sir, I accept!

So, I'm not generally opposed to the conclusion that New York ¢ity is an expensive place to live. (God knows I could use an extra $500K a year to spend on all those things that I've heard the city is supposedly famous for but that I'm too poor to experience.) The authors of this article seem to be basically assuming that conclusion from the beginning. In a sense, all this "news" piece is even claiming to do is put some quantitative weight behind a stereotype that we've all pretty much agreed on already. But since it involves numbers, I can't resist picking apart their methodology a little. The Devil, as always, is in the details:

First off, I had to do some considerable digging to even get to the original source of this email-forward-ready statement that $50,000 Houston dollars is equivalent to $123,322 Dollars New York ($NY). The Times article cites a report from the oddly-named Center for an Urban Future, which used a cost-of-living calculator from the CNN (yes, CNN) website, which had as its source material a survey done by the Council for Community and Economic Research (C2ER), in which they hired surveyors to sample prices from various cities they wanted to compare (more on that later). The (Center for an Urban Future) report is a 52 page document entitled "Reviving the City of Aspiration" about ongoing trends in the middle class of America, particularly in New York. One problem right off the bat is that the authors never precisely define what they mean by "middle class". They write, "In this study, we use ['middle class'] to indicate those who own homes or who have the prospect of becoming homeowners, earn at least in the middle quintile of wages and enjoy a modicum of economic stability." They then go on to wax poetic for a while about the important contributions middle class Americans make to society (including "providing the customer base for a wide mix of businesses across the city," adding to New York's "street life" and, somewhat circularly, owning homes). But setting aside the logical hiccup for a minute, it's still not clear from the definition who exactly qualifies as middle class. Rather, it's somewhat clear what the minimum standards are for membership--you have to own a home or have "the prospect" of doing so, earn "at least in the middle quintile of wages," which is sloppily phrased but I'm guessing means you have to earn more than at least 40% of people in the area, and have "a modicum" of economic stability, which they explain as being able to consistently pay your bills--but there seems to be no clear maximum standards. For example, would someone earning $250K per year in the 98th percentile be considered middle class, assuming he owned a house and could pay his bills (for monocle cleaning and storage)? Maybe, by the authors' definition, but certainly not by mine.

Now, if we trace this comparison-of-cities data all the way back to its source, the C2ER survey, we find an interesting disparity. The basic idea of the survey was to follow some sample of people around and make a log of the prices of all the things they paid for--clothes, food, entertainment, travel, etc.--to get a measurement of the relative cost of living in different places. However, in the guidelines for the survey participants, it says specifically that the authors are not looking for middle class consumers to follow around (they changed their original survey language because "it was too easily confused with 'middle class,' which isn't the same thing at all"); rather, they focus on a population they call "moderately affluent professional and managerial households", who are characterized as "a household consisting of both spouses and one child (for pricing apartments, it is assumed that the couple is childless or the individual is single)" with the criteria that "both spouses hold college degrees; at least one has an established professional or managerial career," and, most significantly, "household income is in the top quintile for the area" (emphasis mine). For most cities, they say that the household annual income should be "between $70,000 and $100,000;" however, as they say, "the appropriate income range will be higher in traditionally high-cost places like New York..." So our monocle-polishing Uncle Moneybags the hedge fund manager would be included in the survey.

What's the real problem with this? Apart from the fact that we've gotten, explicitly, pretty far away even from the ill-defined "middle class" of the Urban Future report, upon whose homeowning backs the street life of the city rests, we've also gotten into some shaky statistical territory, where I believe we're not even comparing apples to apples anymore, but rather something like apples to different kinds of apples (Fuji to Jonagold), to learn all about oranges. And also the middle class. I don't have any hard data to back me up here, but my sense from having lived in New York for a little while now is that, due to the presence of so many ultra rich celebrities and financiers, the shape of the distribution of incomes here is more heavily slanted towards the top ("fat-tailed," as they say), meaning not only is the average income higher, but the relative difference between the top 20% and those of us way down in the middle is considerably greater than in other U.S. cities. In pictures, the graph of incomes in New York is more like this:


than this:


In the latter case (Houston), it doesn't take much more income to put you in the top 20%, but in New York, it takes considerably more. So, the potential gap in luxury lifestyles is exaggerated, and as a result, more especially luxurious opportunities open up for those who can afford them. There really just isn't a Houston equivalent of buying a $150 truffle and foie gras burger at Bistro Moderne or paying $75K per year for a personal driver or all the other outrageous things the Times article mentions.

Which all brings me all the way around to the point: that measuring what it costs to uphold a "standard of living" is an extremely difficult and subtle problem, one which requires a great deal of precision and care. And it may not really be possible when the markers of that standard vary so greatly from place to place. New York is a pretty special town with no real equivalent anywhere else in the U.S., and in fact, based on the ways we live our lives, renting instead of owning, riding the subway instead of driving, eating fancy burgers made out of goose liver... it may not even make sense to think of it as part of the U.S., despite its importance as a cultural hub.

Like the old song goes, "New York, New York, it's a pretty special town with no real equivalent anywhere else in the U.S., and in fact, based on the ways we live our lives, renting instead of owning, riding the subway instead of driving, eating fancy burgers made out of goose liver... it may not even make sense to think of it as part of the U.S., despite its importance as a cultural hub."

-DrM


P.S.--To Short Round: oddly enough, it seems that "average median" is correct there. In the report, they averaged together the median incomes of the various ethnic groups in the suburbs of Houston, presumably with some weighting. Hence, average median income. Weird.